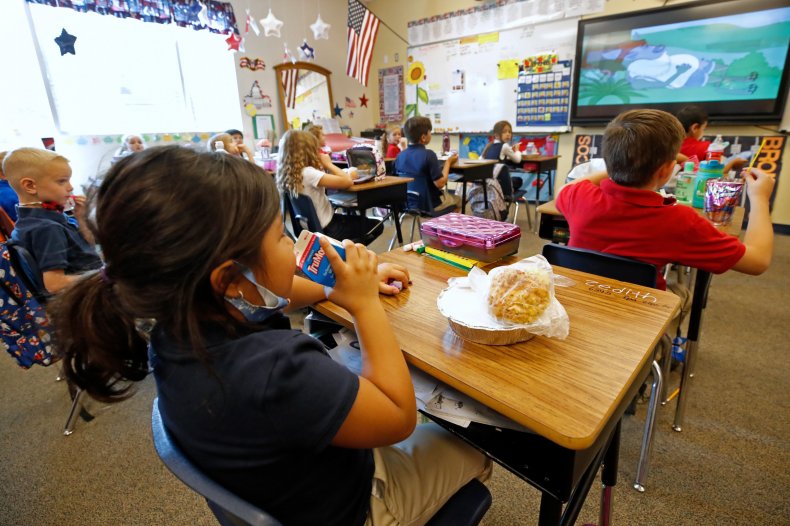
Mississippi has the least safe conditions for schools to reopen amid the ongoing coronavirus outbreak, followed by South Carolina, Arkansas, Arizona and Nevada, in the top five ranking of the 50 states, according to a new study looking at the risk of COVID-19 infection as well as health and financial infrastructure within each state.
The study by WalletHub, a personal finance website based in Washington, D.C., evaluated 15 metrics, including the number of child COVID-19 cases and deaths per 100,000 children, average class sizes, public mask usage and a string of other variables for each state (see full listing of metrics used further below).
“Each metric was graded on a 100-point scale, with a score of 100 representing the safest conditions,” the study noted.
It then “determined each state’s weighted average across all metrics to calculate its overall score and used the resulting scores to rank-order the states,” the study explained.
The data used to determine this ranking of the states was taken from various sources including the U.S. Census Bureau, the American Academy of Pediatrics, the COVID Tracking Project, the Kaiser Family Foundation, School Bus Fleet Magazine, the National Center for Education Statistics, The Annie E. Casey Foundation, Covid19-projections.com, eSchool+ Initiative from Johns Hopkins University and the American Civil Liberties Union, in addition to research by WalletHub, the study noted.
Top 10 least safe states for schools to reopen
Newsweek subscription offers >
Source: WalletHub, as of September 28.
- Mississippi: overall score of 43.04 (out of 100)
- South Carolina: 43.61
- Arkansas: 45
- Arizona: 45.71
- Nevada: 46.14
- Tennessee: 46.85
- Missouri: 49.88
- Utah: 49.90
- Louisiana: 50.61
- Florida: 50.71
Louisiana, Mississippi, South Carolina, Arizona and Tennessee have the most child COVID-19 infections per 100,000 children, while Alabama and Nevada joined Louisiana, Arizona and Tennessee for having the most child COVID-19 deaths per 100,000 children, the study found.
Alaska, Wyoming, Montana, Wisconsin, West Virginia and Missouri have the “highest overall likelihood of COVID-19 infections,” while Colorado, Oregon, California, Michigan and Utah have the “highest average public school class size,” according to the study.
Maine, Connecticut, New Hampshire, Mississippi and Minnesota have the “highest share of K-12 public school students transported through school transportation,” the study found.
Metrics used
Risk of COVID-19 infections
Total points: 60
- Child COVID-19 cases per 100,000 children (8 points)
- Child COVID-19 deaths per 100,000 children (8 points)
- COVID-19 cases in the last seven days per 100,000 residents (8 points)
- Public mask usage (4 points): This metric measures the presence or absence of state action requiring residents to wear a face mask in public:
- 1 – No state action on public face coverings.
- 0.5 – State requires the use of face coverings for certain employees.
- 0.25 – State allows local officials to require the use of public face coverings for the general public.
- 0 – Face coverings required for the general public.
- Share of K-12 public school students transported through school transportation (8 points): This metric was calculated as follows: public K-12 students transported daily/ total K-12 students enrolled, the study noted
- Average public school class size (4 points): This composite metric takes into account primary schools, middle schools and high schools, the study explained.
- Pupil-teacher ratio (4 points)
- Share of seniors living with school-age children (8 points): This metric refers to “seniors” as individuals aged 65 and older and “School-age Children” as 5 to 18 years old, the study noted.
- Share of children living in crowded housing (4 points): This metric refers to the share of children under age 18 living in households that have more than one person per room, the study noted.
- Overall likelihood of COVID-19 infections (4 points): This metric refers to the current COVID-19 transmission number, which is an estimate of the average number of people to whom an infected person will transmit the COVID-19 virus, the study noted.
Health and financial infrastructure
Total points: 40
- Comprehensive school reopening guidance (13.33 points): This metric scores how many of the 12 criteria considered are addressed in the respective state’s school reopening policies. The 12 criteria noted are:
- Core academics
- SARS CoV2 protection
- Before & after school programs
- School Access & transportation
- Student health services
- Food & nutrition
- Parent choice
- Teacher & staff choice
- Children with special needs / ESL / gifted and twice exceptional
- Children of poverty and systemic disadvantage
- Privacy
- Engagement and transparency
- WalletHub’s “Best & Worst States for Children’s Health Care” score (8.89 points): This metric is based on WalletHub’s “Best & Worst States for Children’s Health Care” ranking.
- WalletHub’s “States with the Best Health Infrastructure for Coronavirus” score (8.89 points): This metric is based on WalletHub’s “States with the Best Health Infrastructure for Coronavirus” ranking, and includes metrics such as: number of hospital beds per capita, intensive care unit (ICU) beds per capita or number of hospital beds most needed exclusively for COVID-19 patients per all hospital beds available, the study noted.
- Student-to-school-nurse ratio (4.44 points)
- Total current spending on elementary and secondary schools per pupil (4.44 points): Current spending includes per pupil spending for salaries and wages, employee benefit payments, current spending for instruction and current spending for support services. The per pupil spending amounts included are derived from current spending totals and the fall membership data. Per pupil expenditure does not include spending for non-elementary-secondary programs (community service, adult education), or spending by a school system for students not included in its fall membership counts, the study noted.
The wider picture
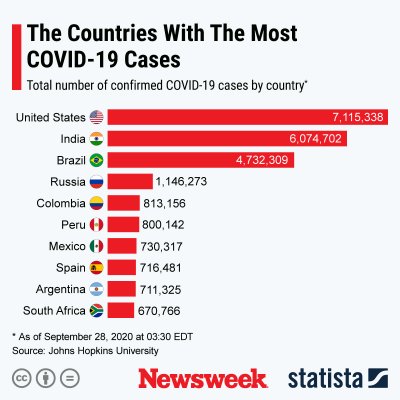
The novel coronavirus has infected over 33.4 million people across the globe, including 7.1 million in the U.S. Over a million people have died globally, while more than 23.1 million people have recovered from infection, as of Tuesday, according to the latest figures from JHU.
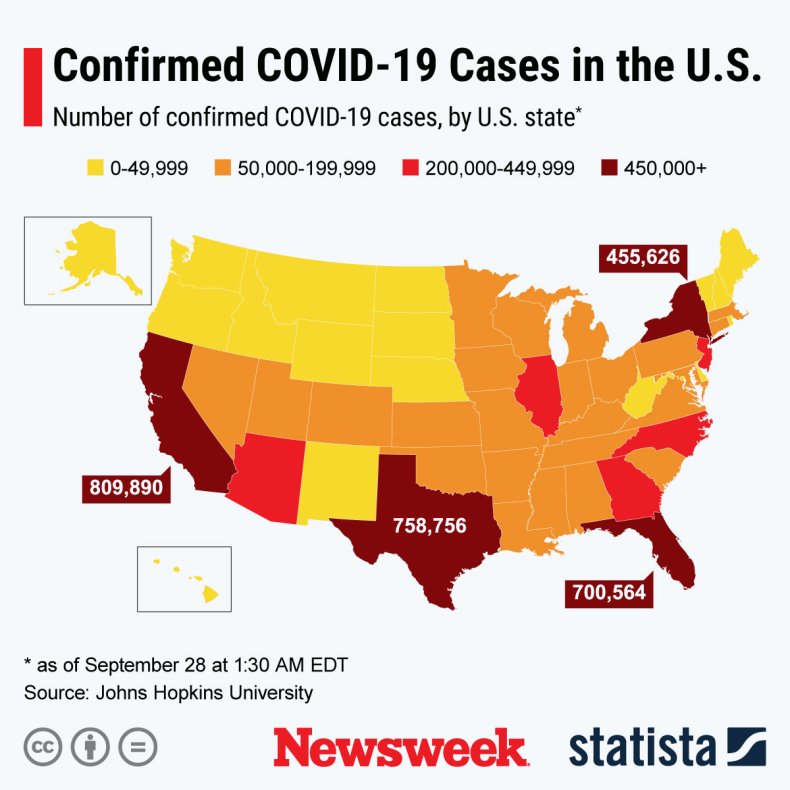
The graphic below, provided by Statista, illustrates U.S. states with the most COVID-19 cases.
 STATISTA
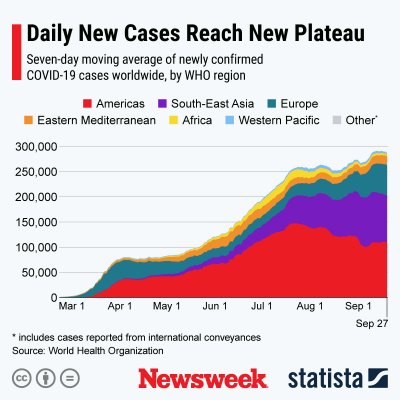
The below graphics, also provided by Statista, illustrate the spread of COVID-19 cases in countries across the globe.
1 of 2
 STATISTA
 STATISTA
  STATISTA