Coronavirus deaths in the U.S. have climbed past 200,800, according to the latest figures from Johns Hopkins University. At least a handful of states in the south of the country have each reported a decline in new deaths per capita (100,000 people) in the latest two-week period.
Here we look at five states that have reported the largest drop in new deaths per capita over the last seven days, from the previous week, according to data compiled by The New York Times. All population data below from the U.S. Census Bureau, as of July 2019.
Florida
Week-to-week change in new deaths per capita: 243
Newsweek subscription offers >
- New deaths per capita in week one: 629
- New deaths per capita in week two: 872
- Total confirmed deaths: 13,415
- Total population: 21,477,737
The seven-day moving average of daily new deaths in Florida increased from late March to mid-April before mostly flattening out through late June. It then rose sharply through early August, peaking at 184 on August 5, before mostly declining through September, according to data compiled by Worldometer.
Newsweek subscription offers >
Arkansas
Week-to-week change in new deaths per capita: 174
- New deaths per capita in week one: 59
- New deaths per capita in week two: 233
- Total confirmed deaths: 1,209
- Total population: 3,017,804
The seven-day moving average of daily new fatalities in Arkansas mostly increased from late March through early September, when it peaked at 19 on September 4. The figure then mostly declined through the rest of the month, according to Worldometer.
Tennessee
Week-to-week change in new deaths per capita: 95
- New deaths per capita in week one: 134
- New deaths per capita in week two: 229
- Total confirmed deaths: 2,236
- Total population: 6,829,174
The seven-day moving average of daily new deaths in Tennessee mostly flattened out from early April to early July before mostly rising through late August. The figure then sharply declined through early September before rising through mid-September, peaking at 33 on September 15, and dipping through the rest of the month, according to Worldometer.
Louisiana
Week-to-week change in new deaths per capita: 52
- New deaths per capita in week one: 108
- New deaths per capita in week two: 160
- Total confirmed deaths: 5,386
- Total population: 4,648,794
The seven-day moving average of daily new fatalities in Louisiana rose sharply from late March to late April, peaking at 66 on April 18. From then, it mostly declined through mid-June before it slightly flattened out through early July. The figure mostly rose again through early August before declining until early September and flattening out after then, according to Worldometer.
Mississippi
Week-to-week change in new deaths per capita: 37
- New deaths per capita in week one: 112
- New deaths per capita in week two: 149
- Total confirmed deaths: 2,846
- Total population: 2,976,149
The seven-day moving average of daily new deaths in Mississippi have been mostly rising from late March through early August, slightly flattening out between mid-May and early July before peaking at 34 on August 4. The figure then mostly declined through September, according to Worldometer.
The wider picture
The novel coronavirus has infected over 31.6 million people across the globe since it was first reported in Wuhan, China, including nearly 6.9 million in the U.S. More than 971,900 have died following infection, while over 21.7 million have reportedly recovered as of Wednesday, according to JHU.
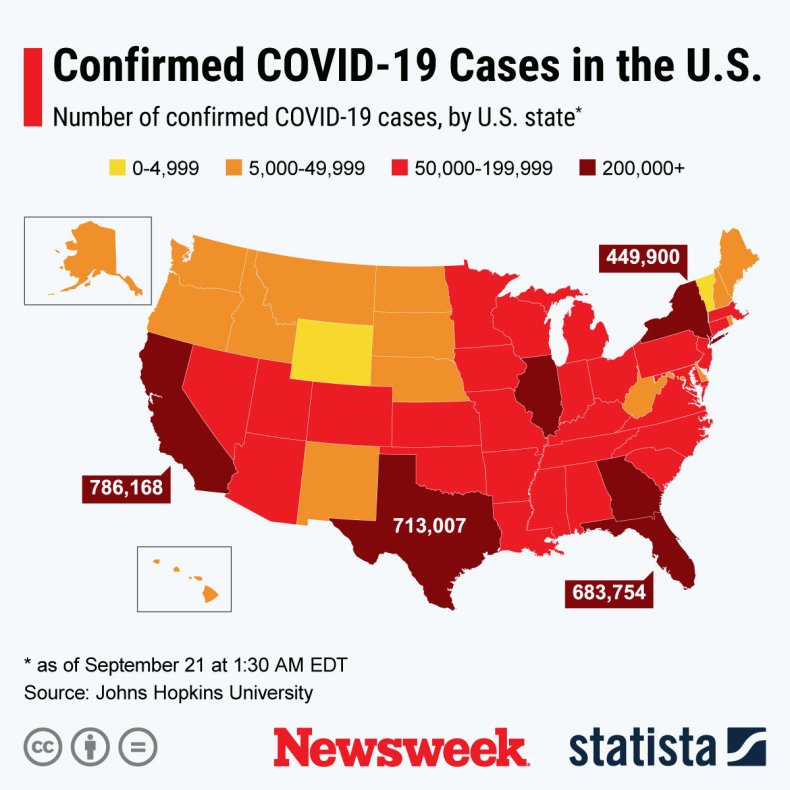
The graphic below, provided by Statista, illustrates U.S. states with the most COVID-19 cases.
 STATISTA
The below graphic, also provided by Statista, illustrates the percentage of Americans who do or don’t want COVID-19 restrictions to be relaxed in the country.
 STATISTA
The graphics below, also provided by Statista, illustrate the spread of COVID-19 cases in counties across the globe.
1 of 2
 STATISTA
 STATISTA
  STATISTA


